How to Enable Debug Mode in WordPress: Your Essential Guide to Troubleshooting Errors
Every WordPress user, from casual blogger to seasoned developer, eventually encounters an error. Whether it’s the dreaded White Screen of Death (WSOD), a cryptic PHP warning, or a plugin conflict causing unexpected behavior, troubleshooting is an inescapable part of managing a WordPress site. Fortunately, WordPress comes equipped with a powerful built-in debugging system designed to help you pinpoint the root cause of these issues: WordPress Debug Mode.
Enabling debug mode in WordPress transforms your site into a diagnostic tool, revealing the hidden errors and warnings that might otherwise go unnoticed. This comprehensive guide will walk you through everything you need to know about WordPress Debug Mode, including how to enable it, advanced configurations, best practices, and how to interpret the information it provides to effectively resolve your site’s issues.
What is WordPress Debug Mode and Why is it Essential?
At its core, WordPress Debug Mode is a feature that, when activated, instructs WordPress to display and log all PHP errors, warnings, and notices generated by your site’s core, themes, and plugins. By default, WordPress suppresses most of these messages for security and user experience reasons on live sites. While this keeps your frontend clean, it can leave you in the dark when something goes wrong.
Enabling debug mode lifts this veil, making these messages visible either directly on your screen or in a dedicated log file. This immediate feedback is invaluable for:
- Identifying the Source of Errors: Debug mode will often tell you the exact file and line number where an error occurred, narrowing down your search significantly.
- Troubleshooting Plugin and Theme Conflicts: If a new plugin or theme update breaks your site, debug mode can show you which component is throwing errors.
- Developing and Testing: Developers rely on debug mode to catch issues in their custom code, themes, and plugins before deployment.
- Performance Optimization: Warnings and notices, while not critical errors, can indicate inefficient code that might be slowing down your site.
- Preventing Future Issues: By understanding the warnings, you can address potential problems before they escalate into critical errors.
Think of it as turning on the diagnostic lights in your car. Without them, you might just notice the engine behaving strangely; with them, you know exactly which system has a fault. For anyone serious about maintaining a robust and error-free WordPress website, understanding and utilizing debug mode is an indispensable skill.
Before You Begin: Important Preparations
Before you dive into modifying your WordPress files, a few crucial steps can save you a lot of headache:
1. Back Up Your Website
This is non-negotiable. Anytime you modify core WordPress files like `wp-config.php`, there’s a risk of introducing new issues. A complete backup (files and database) ensures you can quickly revert your site to a working state if anything goes wrong. Many hosting providers offer one-click backup solutions, or you can use a reliable backup plugin.
2. Use a Staging or Development Environment
Ideally, you should never enable debug mode (especially with on-screen error display) on a live, production website. Exposing error messages to the public can be a security risk, revealing sensitive information about your server environment or plugin versions. Furthermore, a barrage of error messages can be off-putting for your visitors.
If possible, create a staging copy of your site or use a local development environment (like XAMPP, MAMP, or Local by WPKube) for debugging. This allows you to experiment freely without impacting your live site’s performance or user experience. For serious development and testing, consider dedicated platforms that allow you to effectively optimize your WordPress development and deployment processes.
3. Access Your Website’s Files
You’ll need access to your WordPress installation files, specifically the `wp-config.php` file. There are two primary ways to do this:
- FTP Client: Use an FTP (File Transfer Protocol) client like FileZilla to connect to your web host and browse your site’s directory.
- cPanel File Manager: Most hosting providers offer cPanel or a similar control panel with a web-based File Manager that allows you to edit files directly.
How to Enable Debug Mode in WordPress: Step-by-Step
Enabling the basic WordPress debug mode is a straightforward process involving a simple modification to your `wp-config.php` file.
Step 1: Connect to Your Website via FTP or File Manager
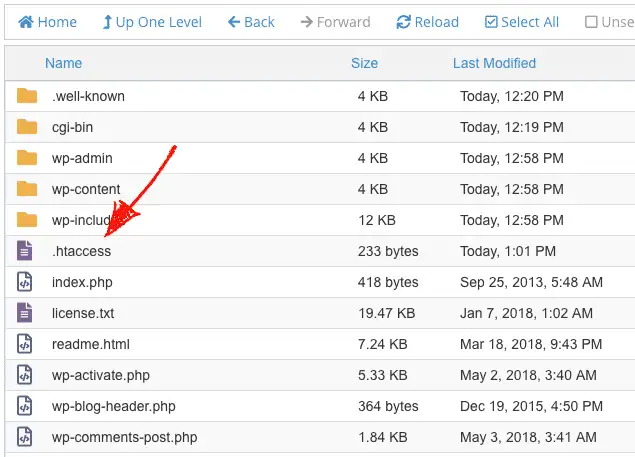
Using your chosen method (FTP client or cPanel File Manager), navigate to the root directory of your WordPress installation. This is typically where you’ll find folders like `wp-admin`, `wp-content`, `wp-includes`, and files like `index.php` and `wp-config.php`.
Step 2: Locate the `wp-config.php` File
The `wp-config.php` file is one of the most critical files in your WordPress installation. It contains your database connection details and other essential configuration settings. Open this file for editing.
Step 3: Find the `WP_DEBUG` Definition
Scroll through the `wp-config.php` file until you find a line that looks like this:
define( 'WP_DEBUG', false );This line, by default, sets `WP_DEBUG` to `false`, meaning debug mode is disabled.
Step 4: Change `false` to `true`
To enable debug mode, simply change the `false` value to `true`:
define( 'WP_DEBUG', true );Step 5: Save and Upload the File
Save the changes to `wp-config.php`. If you’re using an FTP client, upload the modified file back to your server, overwriting the old one. If you’re using cPanel File Manager, simply save the changes within the editor.
That’s it! WordPress Debug Mode is now active. When you refresh your WordPress site, you might start seeing error messages, warnings, or notices directly on your screen. While this can look alarming, it’s precisely what you want when troubleshooting.
Advanced Debugging Constants for Finer Control
While `WP_DEBUG` is the primary constant, WordPress offers several other debugging constants that provide more granular control over how errors are displayed and logged. These are especially useful for balancing the need for information with security and user experience concerns.
1. `WP_DEBUG_DISPLAY` (Control On-Screen Errors)
This constant controls whether debug messages are shown on the HTML pages. When `WP_DEBUG` is `true`, `WP_DEBUG_DISPLAY` defaults to `true` as well. For production sites, or when you don’t want to expose errors to visitors, you should set this to `false`.
To disable on-screen error display but keep logging active:
define( 'WP_DEBUG', true );
define( 'WP_DEBUG_DISPLAY', false );
Place this line after `define( ‘WP_DEBUG’, true );` in your `wp-config.php` file.
2. `WP_DEBUG_LOG` (Log Errors to a File)
This is arguably the most important advanced debugging constant for production environments. When set to `true`, all error messages are saved to a file named `debug.log` within your `wp-content` directory, instead of being displayed on screen. This allows you to collect error information without impacting user experience or security.
To enable error logging:
define( 'WP_DEBUG', true );
define( 'WP_DEBUG_LOG', true );
define( 'WP_DEBUG_DISPLAY', false ); // Strongly recommended for live sites
Again, ensure these lines are placed after `define( ‘WP_DEBUG’, true );`.
3. `SCRIPT_DEBUG` (Load Development Versions of Core JS/CSS)
This constant forces WordPress to use the “dev” versions of its core CSS and JavaScript files instead of the minified versions. These unminified files are much easier to debug if you suspect an issue with WordPress’s core scripts.
To enable `SCRIPT_DEBUG`:
define( 'SCRIPT_DEBUG', true );This is generally placed with the other debug constants. Note that enabling this will likely slow down your site slightly due to loading larger, unminified files.
4. `SAVEQUERIES` (Save Database Queries)
When set to `true`, this constant stores database queries, their execution time, and what function called them in an array. This can be extremely useful for debugging database performance issues or complex plugin interactions with the database.
To enable `SAVEQUERIES`:
define( 'SAVEQUERIES', true );You’ll typically access this information through a plugin like Query Monitor (discussed later) or by directly inspecting the `$wpdb->queries` array using custom code, usually in a theme’s `functions.php` file (but only for development purposes).
Using the Debug Log File (`debug.log`)
If you’ve enabled `WP_DEBUG_LOG`, a file named `debug.log` will be created inside your `wp-content` directory. This file is a treasure trove of information during troubleshooting. Here’s how to work with it:
Locating the `debug.log` File
Using your FTP client or cPanel File Manager, navigate to the `wp-content` folder within your WordPress root directory. You should find the `debug.log` file there. If you don’t see it immediately after enabling `WP_DEBUG_LOG` and refreshing your site, try navigating to a few different pages on your site to trigger some processes that might generate logs.
Interpreting the Log Entries
The `debug.log` file will contain a series of entries, each typically formatted like this:
[23-May-2024 10:35:12 UTC] PHP Warning: require_once(/path/to/your/site/wp-content/plugins/malfunctioning-plugin/includes/file.php): failed to open stream: No such file or directory in /path/to/your/site/wp-content/themes/your-theme/functions.php on line 45
[23-May-2024 10:35:12 UTC] PHP Fatal error: Uncaught Error: Call to undefined function broken_function() in /path/to/your/site/wp-content/plugins/another-plugin/another-file.php:123
Stack trace:
#0 /path/to/your/site/wp-includes/class-wp-hook.php(324): another_plugin_init('')
#1 /path/to/your/site/wp-includes/class-wp-hook.php(348): WP_Hook->apply_filters('', Array)
#2 /path/to/your/site/wp-includes/plugin.php(517): WP_Hook->do_action(Array)
#3 /path/to/your/site/wp-settings.php(617): do_action('plugins_loaded')
#4 /path/to/your/site/wp-config.php(100): require_once('/path/to/your/site/wp-settings.php')
#5 /path/to/your/site/wp-load.php(50): require_once('/path/to/your/site/wp-config.php')
#6 /path/to/your/site/wp-admin/admin.php(34): require_once('/path/to/your/site/wp-load.php')
#7 {main}
thrown in /path/to/your/site/wp-content/plugins/another-plugin/another-file.php on line 123
Key information to look for in each log entry:
- Timestamp: Indicates when the error occurred.
- Error Type: PHP Notice, PHP Warning, PHP Fatal error, PHP Parse error, etc. Fatal errors are site-breaking; warnings and notices are less severe but still indicate potential issues.
- Message: A description of what went wrong.
- File Path: The exact file where the error originated. This is often the most critical piece of information, pointing directly to a specific plugin, theme, or core file.
- Line Number: The precise line within the file where the error occurred.
- Stack Trace (for Fatal Errors): A detailed list of the functions and files that were called leading up to the fatal error, helping you trace the execution path.
By analyzing these details, you can quickly identify whether the problem lies with a specific plugin, your active theme, custom code, or even the WordPress core itself. For example, if you see an error originating from `wp-content/plugins/your-plugin-name/`, you know precisely where to focus your troubleshooting efforts.
Best Practices for Debugging in WordPress
While debug mode is powerful, using it effectively requires adherence to certain best practices:
1. Always Debug on a Staging Site
As mentioned, avoid using `WP_DEBUG_DISPLAY` on live sites. Even `WP_DEBUG_LOG` should ideally be used sparingly on production, only when actively troubleshooting, and then promptly disabled once the issue is resolved.
2. Disable Debug Mode When Done
Once you’ve identified and fixed the issue, revert `define( ‘WP_DEBUG’, true );` back to `define( ‘WP_DEBUG’, false );` (and remove or comment out any other debug constants you added). Leaving debug mode active can be a security risk and can also impact site performance.
3. Use a Child Theme
If you’re modifying your theme’s files, always use a child theme. This ensures that your changes aren’t overwritten when the parent theme receives an update. Debugging theme-related issues is much safer and more sustainable with a child theme in place.
4. Deactivate Plugins One-by-One
A common troubleshooting technique is to deactivate all plugins and then reactivate them one by one, checking your site after each activation. If an error reappears after activating a specific plugin, you’ve found the culprit. Debug mode enhances this process by telling you exactly what type of error that plugin is generating.
5. Switch to a Default WordPress Theme
Similar to plugins, themes can also cause conflicts. If you suspect your theme is the problem, switch to a default WordPress theme (like Twenty Twenty-Four) to see if the error persists. If it disappears, the issue is with your custom or premium theme. Remember to back up customizer settings or widgets if you do this on a live site.
6. Don’t Ignore Notices and Warnings
While fatal errors demand immediate attention, PHP notices and warnings can indicate underlying code quality issues or deprecated functions that could lead to bigger problems down the line, especially with future WordPress updates or PHP version changes. Addressing these proactively improves your site’s stability and longevity.
Alternative Debugging Tools and Plugins
While the built-in WordPress debug mode is powerful, several plugins and tools can further enhance your debugging experience, providing more user-friendly interfaces and additional insights.
1. Query Monitor
Query Monitor is an indispensable free plugin for any WordPress developer or power user. It provides a comprehensive developer tools panel showing database queries, PHP errors, hooks and actions, script and stylesheet dependencies, HTTP API calls, and much more. It integrates seamlessly into your WordPress admin bar, presenting debugging information in a clean, organized manner. If you’ve enabled `SAVEQUERIES`, Query Monitor is excellent for visualizing that data.
2. Debug Bar
Debug Bar is another popular plugin that adds a debug menu to the WordPress admin bar. It displays query, cache, and other helpful debugging information. While less comprehensive than Query Monitor, it’s lightweight and often sufficient for basic debugging needs.
3. Kinsta MU Plugin (for Kinsta users)
If your site is hosted on Kinsta, their custom MU (Must-Use) plugin includes a built-in debugging tool that displays errors, warnings, and notices in a dedicated log viewer within your MyKinsta dashboard. This offers a convenient way to monitor errors without needing to access `wp-config.php` or `debug.log` via FTP.
Troubleshooting Common WordPress Errors with Debug Mode
Let’s look at how debug mode specifically helps with some frequent WordPress problems:
1. The White Screen of Death (WSOD)
The WSOD is perhaps the most frustrating error because it provides no information. When `WP_DEBUG_DISPLAY` is enabled, the WSOD often transforms into an error message, revealing the exact file and line causing the problem. Most commonly, it points to a plugin or theme file that has a syntax error or memory exhaustion.
2. Memory Exhausted Errors
If you see an error like “Fatal error: Allowed memory size of X bytes exhausted…”, it means a script (usually a plugin or theme function) has used up all the memory allocated to PHP. Debug mode helps identify which specific script is the culprit. The solution usually involves increasing your WordPress PHP memory limit (often in `wp-config.php` or `php.ini`).
3. Syntax Errors
A simple missing semicolon or an extra bracket can bring your site down with a “Parse error: syntax error…” message. Debug mode will show you precisely which file and line to fix.
4. Plugin and Theme Conflicts
When two plugins or a plugin and a theme try to use the same function name, or if one’s code interferes with another, it can lead to errors. Debug mode’s detailed messages often hint at the conflicting components, helping you isolate the problematic plugin or theme.
Security Considerations: Why Not to Leave Debug Mode On
While incredibly useful, leaving WordPress Debug Mode enabled on a live site, especially with `WP_DEBUG_DISPLAY` set to `true`, poses significant security risks:
- Information Disclosure: Error messages can reveal sensitive information about your server’s file paths, database structure, PHP version, and potentially even deprecated functions that could be exploited by attackers.
- User Experience: A site plastered with error messages looks unprofessional and can drive visitors away.
- Performance Impact: Logging errors and displaying them on screen adds overhead, potentially slowing down your site.
Always disable debug mode once you’ve resolved your issue, or at the very least, ensure `WP_DEBUG_DISPLAY` is `false` on production sites and rely solely on `WP_DEBUG_LOG` for error collection.
Conclusion: Empowering Your WordPress Troubleshooting
Enabling debug mode in WordPress is an essential skill for anyone managing a website powered by this versatile CMS. It transforms the daunting task of troubleshooting into a systematic process, providing the clear, actionable information needed to identify and resolve issues efficiently. By understanding how to activate `WP_DEBUG` and its companion constants, interpreting the `debug.log` file, and adhering to best practices, you equip yourself with the primary tool for maintaining a healthy, error-free WordPress site.
Don’t let errors leave you frustrated and guessing. Embrace the power of WordPress Debug Mode, and you’ll find yourself confidently tackling even the most stubborn website problems. For more advanced troubleshooting techniques and to delve deeper into WordPress optimization with our comprehensive guides, be sure to explore our extensive collection of resources.
- How to Enable Debug Mode in WordPress: Your Essential Guide to Troubleshooting Errors
- How to Find, Create, and Master Your WordPress .htaccess File
- How to Extract a .wpress File: Your Comprehensive Guide to Unpacking WordPress Backups
- The Ultimate Guide to Installing WordPress Plugins: Step-by-Step for Every User
- Fixing YouTube Video Display Errors in WordPress: A Comprehensive Troubleshooting Guide
Related articles:
-

Unlock Any Site’s Secret: WordPress Theme Detector
-

Ultimate WordPress Hosting Guide: Speed & Security
-

Install WordPress: Your Complete Step-by-Step Guide
-

How to Rename WordPress Theme Folder (Without Errors)
-
Fixing YouTube Video Display Errors in WordPress: A Comprehensive Troubleshooting Guide
-

How to Extract a .wpress File: Your Comprehensive Guide to Unpacking WordPress Backups
-

How to Handle Common Elementor Errors: Your Ultimate Troubleshooting Guide
-

How to Install Flatsome Theme on WordPress: A Complete Step-by-Step Guide
-

How to Create a Child Theme for Any WordPress Theme: The Definitive Guide
-
Guide to Installing WordPress Themes: A Comprehensive Step-by-Step Tutorial
-

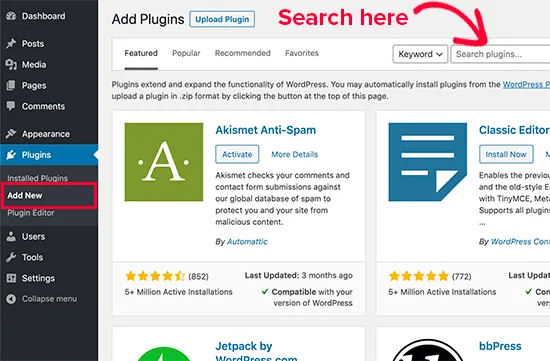
The Ultimate Guide to Installing WordPress Plugins: Step-by-Step for Every User
-

How to Find, Create, and Master Your WordPress .htaccess File